Households Targeted
High-risk households stabilised through integrated support packages.
500+ Households
Impact & learning
Behind every number is a family, a classroom, a field, a community group. We combine quantitative indicators with lived experience to understand how our work changes the drivers of irregular migration.
High-risk households stabilised through integrated support packages.
500+ Households
Of direct participants are women, adolescent girls, or young people.
60% Participants
Focus communities across Nigeria's migration and displacement hotspots.
17+ Communities
A glimpse into Utese Secondary School, February 2026 - where young people are gaining the skills, confidence, and support systems that make migration a choice, not a necessity.
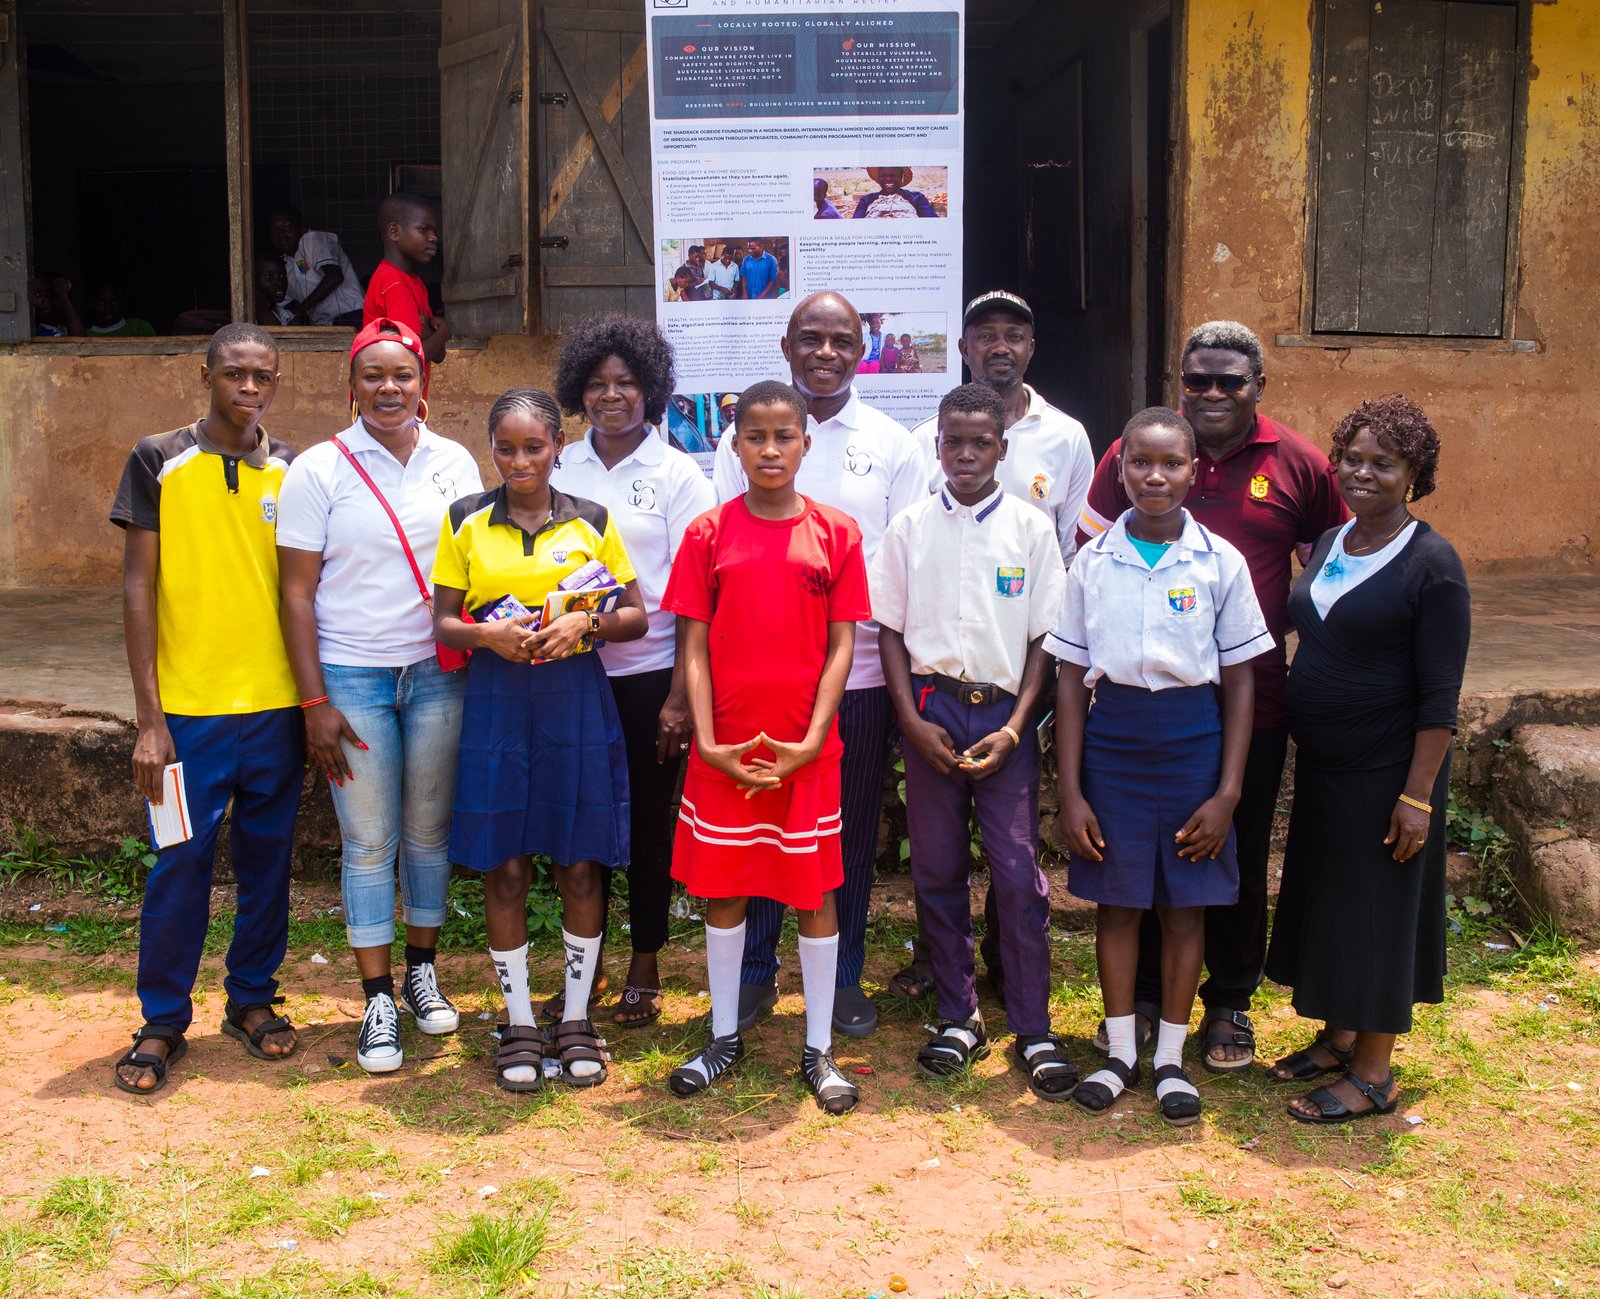
A flagship initiative bringing together students, teachers, and community leaders around practical life skills, psychosocial support, and pathways to dignified livelihoods.
View full gallery →Small-group sessions focused on decision-making, financial literacy, and futures planning for young people in high-risk communities.
Joint sessions with parents, caregivers, and school leadership aligning around protection, aspirations, and realistic livelihood pathways.
Each project is built on a clear theory of change, logical framework, and indicator set, with routine data collection at baseline, midline, and endline.
Feedback mechanisms - such as suggestion boxes and community forums - are accessible to all, with special attention to women and youth.
We welcome partnerships with universities and think tanks interested in understanding the links between local resilience and migration drivers.
A comprehensive overview of our activities, partners, and financials.
Technical overview of our community-driven economic models.
Our commitment to protection and ethical conduct.